
Enabling Sleep Analysis
The project aimed to design data visualizations for analysis of sleep data. The challenge was to visualize it in a way that enabled health coaches to identify discrepancies easily and accurately.
Designing flight price tracking for an existing flight aggregator product, greatescape.co.
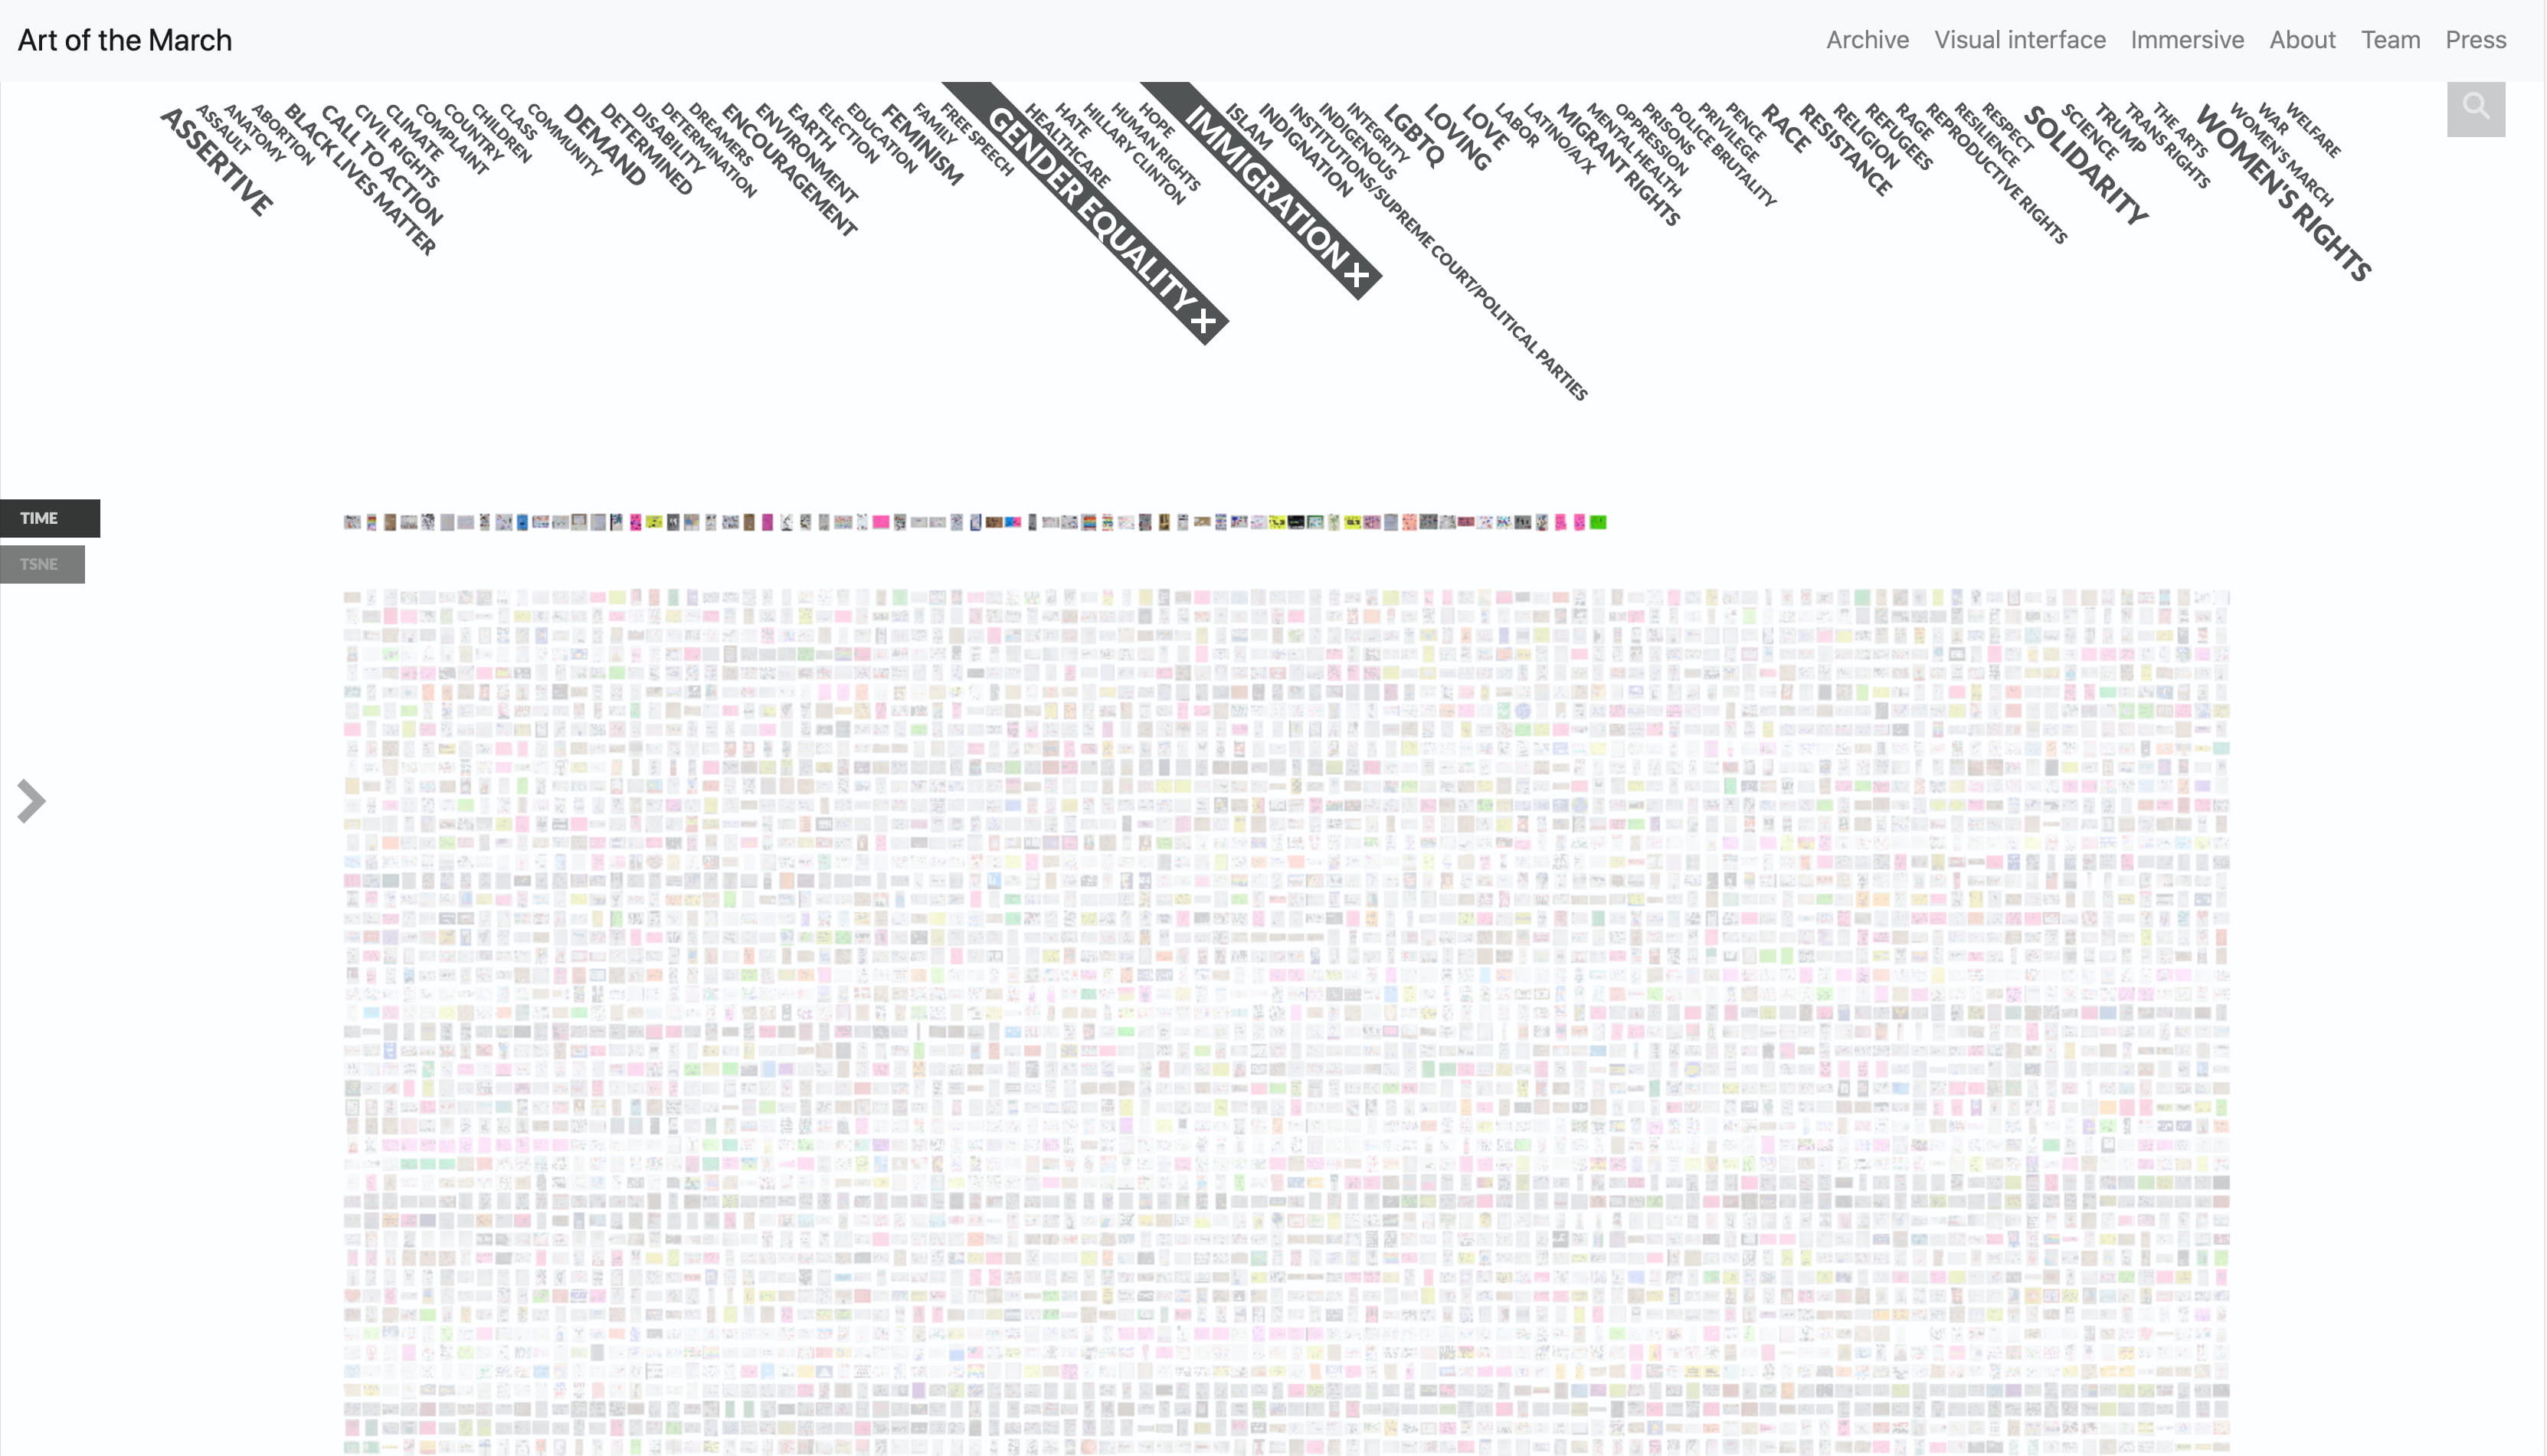
This project is an archive of the posters that people carried and displayed at March for Women in Boston in 2016. It is a representation of political dissent of people. It represents a method of persuasion citizens try out in a civil/political discourse.
I realized that a lot of genealogy diagrams of LOTR already exist. So I decided to add a little twist to mine: instead of people being the main characters in my visualization, swords would take the front stage.
Sundarbans is a forest in the western coastal region of Bangladesh in Bay of Bengal. It was declared UNESCO World Heritage Site in 1997. This project was done as a brand design exercise for Sundarbans.
This infographic poster visualizes the different quantitative data points about Romania, along with the country's brief history.
A personal data project about a particular week of digital media usage of my life. I loved all the different approaches I tried, read the case study to check them out.